多项式回归
多项式回归的概念
多项式回归是一种非线性回归方法,它通过拟合数据与多项式函数的关系来建立模型。与线性回归不同,多项式回归的模型假设不再是线性的,而是一个多项式函数。
多项式回归的一般形式为:
其中, 是特征变量, 是目标变量, 是模型参数, 是多项式的阶数。
为什么需要多项式回归?
在一些实际问题中,数据的关系可能不是线性的,而是呈现出曲线或曲面的特征。这时候,使用多项式回归可以更好地拟合数据的非线性关系,从而提高模型的预测精度。
示例:多项式回归的应用
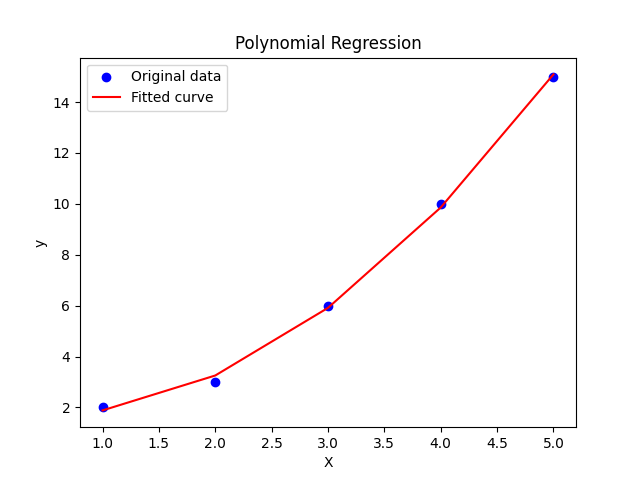
假设有一个简单的数据集,包含自变量 和因变量 。使用多项式回归来拟合这个数据集,并进行预测。
Python
import numpy as np
import matplotlib.pyplot as plt
from sklearn.preprocessing import PolynomialFeatures
from sklearn.linear_model import LinearRegression

# 准备数据
X = np.array([1, 2, 3, 4, 5]).reshape(-1, 1)
y = np.array([2, 3, 6, 10, 15])

# 创建多项式特征
poly = PolynomialFeatures(degree=2)  # 选择二次多项式
X_poly = poly.fit_transform(X)

# 创建并拟合多项式回归模型
model = LinearRegression()
model.fit(X_poly, y)

# 在训练数据上进行预测
y_pred = model.predict(X_poly)

# 绘制原始数据和拟合曲线
plt.scatter(X, y, color='blue', label='Original data')
plt.plot(X, y_pred, color='red', label='Fitted curve')
plt.xlabel('X')
plt.ylabel('y')
plt.title('Polynomial Regression')
plt.legend()
plt.show()在这个例子中,我们首先准备了一个简单的数据集,包含自变量 和因变量 。然后,我们使用PolynomialFeatures类来创建二次多项式特征。接下来,我们使用LinearRegression类来拟合多项式回归模型,并在训练数据上进行预测。最后,将原始数据和拟合曲线绘制在同一张图上,以可视化拟合效果。
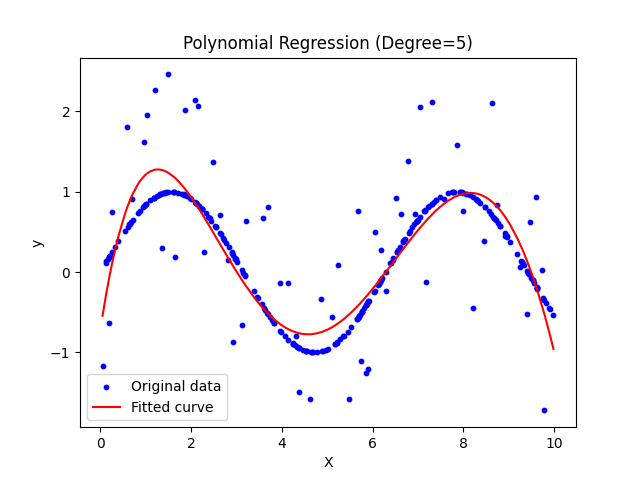
上面的数据比较少,很难模拟真实状况
Python
import numpy as np
import matplotlib.pyplot as plt
from sklearn.preprocessing import PolynomialFeatures
from sklearn.linear_model import LinearRegression

# 生成数据
np.random.seed(0)
X = np.sort(10 * np.random.rand(300, 1), axis=0)
y = np.sin(X).ravel()

# 添加噪声
y[::5] += 3 * (0.5 - np.random.rand(60))

# 创建多项式特征
poly = PolynomialFeatures(degree=5)  # 选择五次多项式
X_poly = poly.fit_transform(X)

# 创建并拟合多项式回归模型
model = LinearRegression()
model.fit(X_poly, y)

# 在训练数据上进行预测
y_pred = model.predict(X_poly)

# 绘制原始数据和拟合曲线
plt.scatter(X, y, color='blue', label='Original data', s=10)
plt.plot(X, y_pred, color='red', label='Fitted curve')
plt.xlabel('X')
plt.ylabel('y')
plt.title('Polynomial Regression (Degree=5)')
plt.legend()
plt.show()